
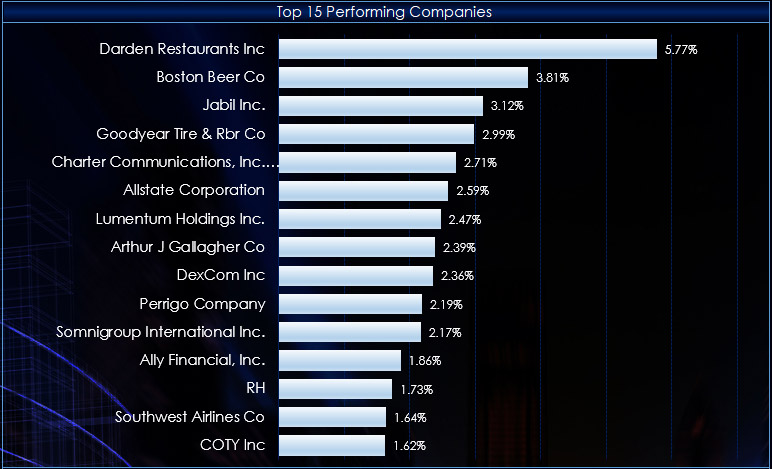
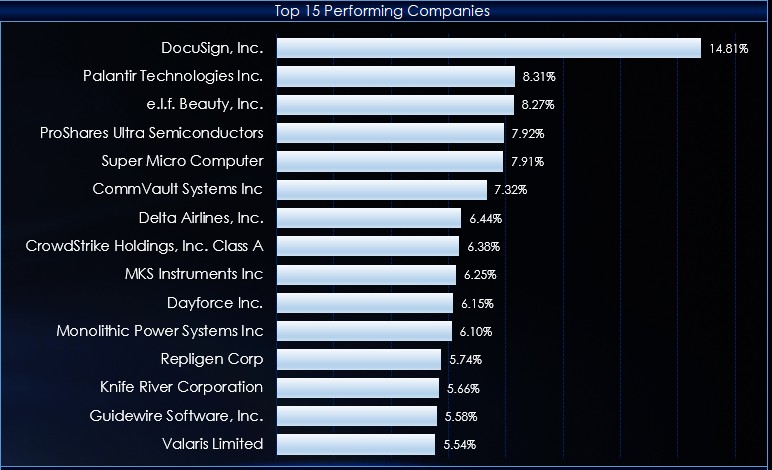
This post details an Excel dashboard tracking Country Equity ETFs performance. The dashboard ranks and sorts the Country ETFs traded using the NYSE American enablement. Fifty-one ETFs are tracked. The market performance ranked and sorted and is divided into four quartiles. The charts show the… more
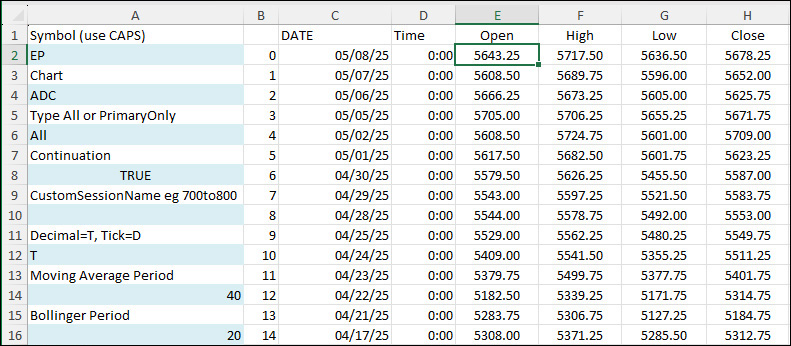
This post offers a downloadable sample Excel spreadsheet for pulling in historical data and study values from CQG IC or QTrader using RTD formulas.
The Data consists of:
Open, High, Low, and Close.VolumeMoving AverageBollinger BandsMACDRSIStochasticsImokuThe Dashboard offers input… more
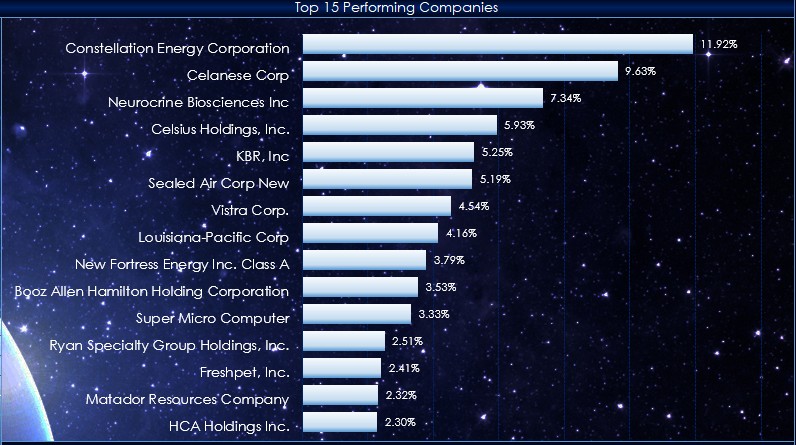
This macro-enabled Microsoft Excel® spreadsheet tracks the holdings of the iShares Russell 1000 Growth ETF (symbol: IWF). The iShares Russell 1000 Growth ETF seeks to track the investment results of an index composed of large- and mid-capitalization U.S. equities that exhibit growth… more
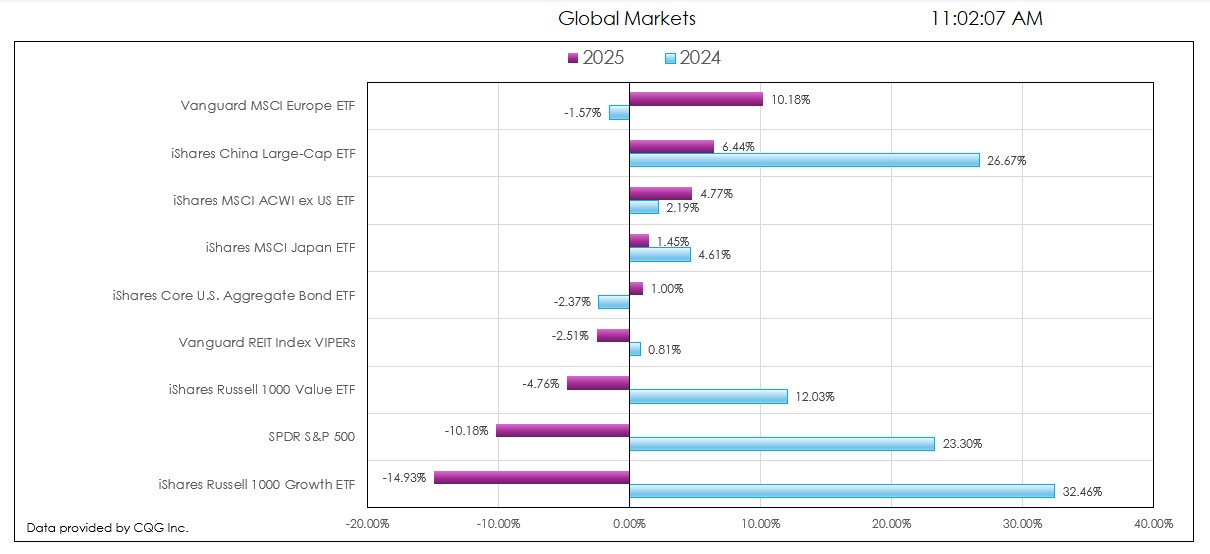
This post details the downloadable Excel Market Performance Dashboard's features and functions. The dashboard has seven tabs (the first is data and the other tabs display a chart and a table of the current session's market activity):
Symbols & Data — Blocks of symbols for the other… more

Various Exchanges offer market data detailing the current state of a market. This includes the CME Group, the Intercontinental Exchange (ICE), CBOE Futures Exchange (CFE), and others.
For this article, the CME Market State information is used as an example.
The CME Globex Trading Day… more
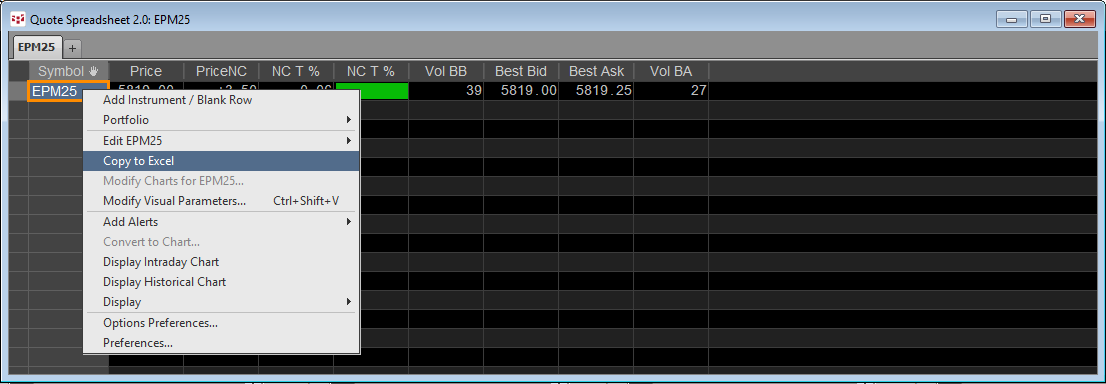
This post details the different techniques for pulling Depth-of-Market (DOM) data into Excel.
There are three ways:
C&P RTD formulas for Level 1 DOM data from the various quote dashboardsUse the CQG RTD ToolkitUse the XL ToolkitCopy & Paste RTD Formulas from the Quote… more
This macro-enabled Microsoft Excel® spreadsheet tracks the holdings of the iShares Core S&P U.S. Value ETF (symbol: IUSV). The iShares Core S&P U.S. Value ETF seeks to track the investment results of an index composed of large- and mid-capitalization U.S. equities that exhibit value… more
This macro-enabled Microsoft Excel® spreadsheet tracks the holdings of the iShares Core S&P U.S. Growth ETF (symbol: IUSG). The iShares Core S&P U.S. Growth ETF seeks to track the investment results of an index composed of large- and mid-capitalization U.S. equities that exhibit growth… more
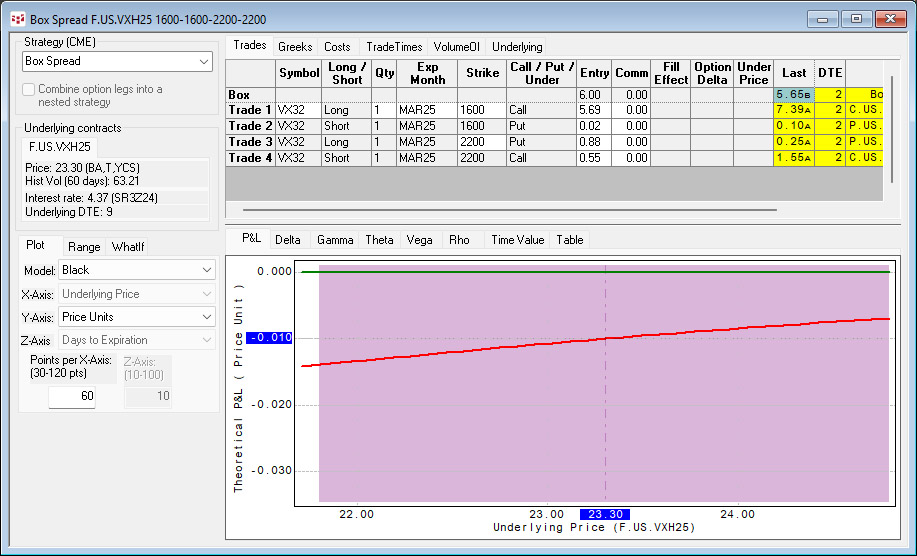
October 14, 2024, the Cboe launched weekly options on the Cboe VIX futures. To find the symbols in IC or QTrader, open the Symbol Search, select Cboe Futures Exchange (CFE), sort the Asset column. The symbol lists the week and the day of the expiration. For example, symbol C.US.VX32 the 32 which… more
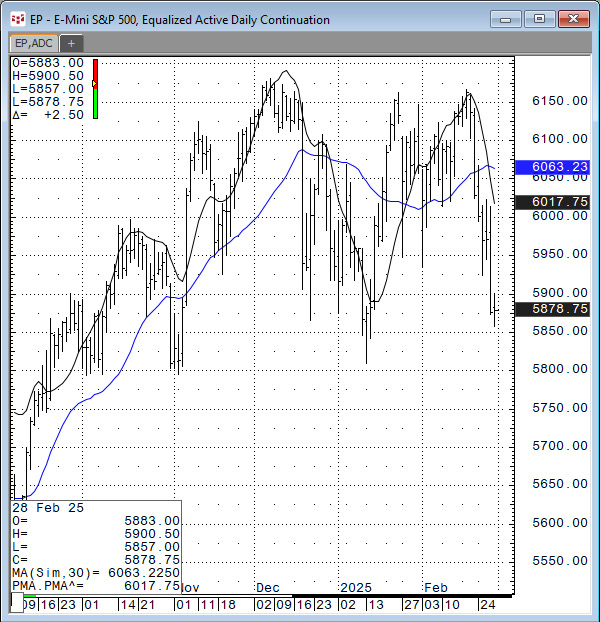
In the March 2025 issue of Technical Analysis of STOCKS & COMMODITIES magazine John Ehlers, President of MESA Software, presented "A New Solution, Removing Moving Average Lag."
The article featured a solution to smoothing market data using a technique that reduced the lag inherent to… more