What's New


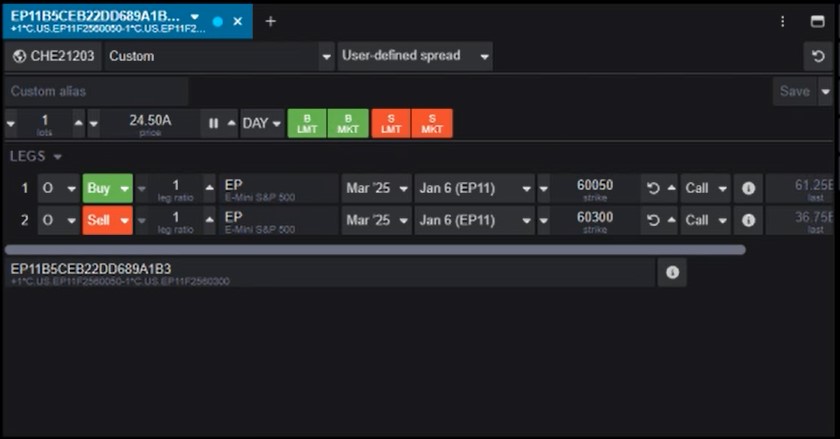
Strategy builder was added in Version 9.9 and replaces Spread Builder.

Strategy Builder

Improved synthetic strategy supportAdded keyboard navigationCustomizable toolbars

This video by CQG Product Specialist Jim Stavros details the steps to setting up a page in CQG One for trading a… more

This recent post "Quote Spreadsheet 2.0 TTM Squeeze and More" provided a page installed via a CQG PAC that included a CQG QSS V2 for monitoring the markets. The benefit of the Quote Spreadsheet 2.0 is a collection of markets, and the status of conditions and study values can be observed in a… more

This post details using CQG's Quote Spreadsheet 2.0, Instrument Monitor, chart and DOMTrader to monitor and trade a portfolio of instruments on a single page.

The benefit of the Quote Spreadsheet 2.0 is a collection of markets, and the status of conditions and study values can be monitored… more

The CQG XL Toolkit, which uses CQG's WebAPI to connect to CQG's servers for data. (unlike the CQG RTD Toolkit which connects to CQG IC or QTrader), has been updated to include pulling in historical bar data. This feature is the third button from the left named "Bars."

The Add-In does… more

This post "TTM Squeeze Indicator" detailed the TTM indicator, which is a combination of measuring volatility and momentum. The volatility is a condition where the Bollinger Bands contract and move within the Kelter Channels. The momentum indicator (histogram bars) is the momentum study smoothed… more

Markets move through phases: An uptrend (higher highs preceded by higher lows), a downtrend (lower lows preceded by lower highs) and sideways or consolidation price action.

Technical based traders look to a host of indicators to identify which phase a market is in to base trading decisions… more

Recent posts detailed observing market data during pre-, current, and post-market sessions. The post View Pre and Post Sessions for Stocks detailed the steps to displaying a chart that included Pre-, Current, and Post-sessions using bid and asks for building the bar data during the Pre- and Post… more

Excel users with RTD links to both market and study data can design a real-time dashboard that can monitor a portfolio of instruments and the status of various studies. This is the topic of this post.

First, be careful regarding the number of instruments and studies being pulled from CQG… more

The Excel MAXIF function returns the maximum value from a range of cells and a criteria range. For example. The downloadable sample at the bottom of this post is determining the best performance of stocks by sectors in the S&P 500 and the NASDAQ 100. The performance statistics are annual,… more

The Excel Treemap chart displays a hierarchical view of the data. The Treemap chart below displays the annualized performance of the 30 stocks in the Dow Jones Industrial Average. The size of the squares indicates the relative performance with Walmart Inc. (S.WMT) up the most and Merck & Co… more