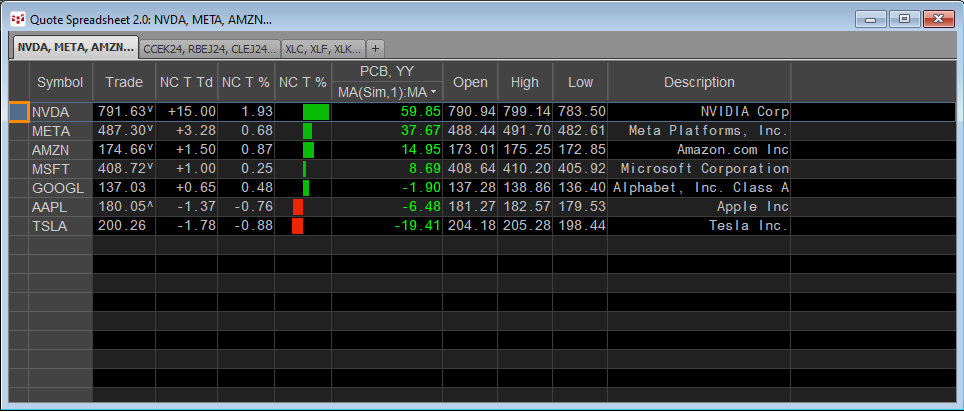
A popular form of market analysis is to maintain a real-time table of market performance based on an annualized basis. For example, the QSS 2.0 displayed below has a sorted column highlighted with the yellow font detailing the percent net change so far for the year by the stocks known as the… more
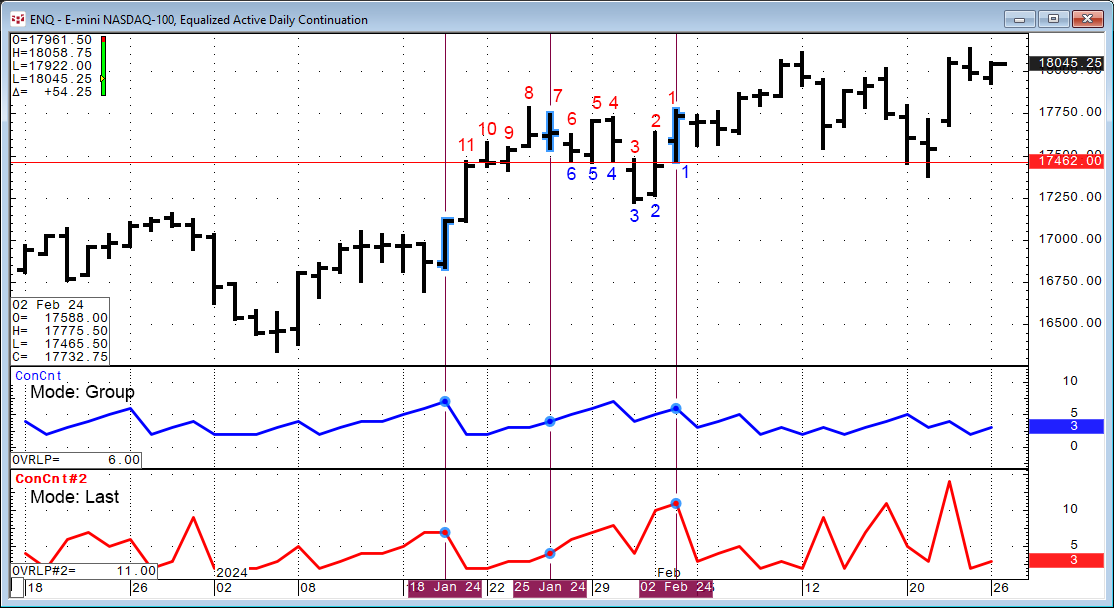
Markets tend to trend up, down, and sideways. Another name for trending sideways is congestion. A period of congestion is when the Open, High, Low, and Close price bars are overlapping. CQG IC and QTrader offer a study to identify periods when a market is in a congestion phase. Here is a link to… more
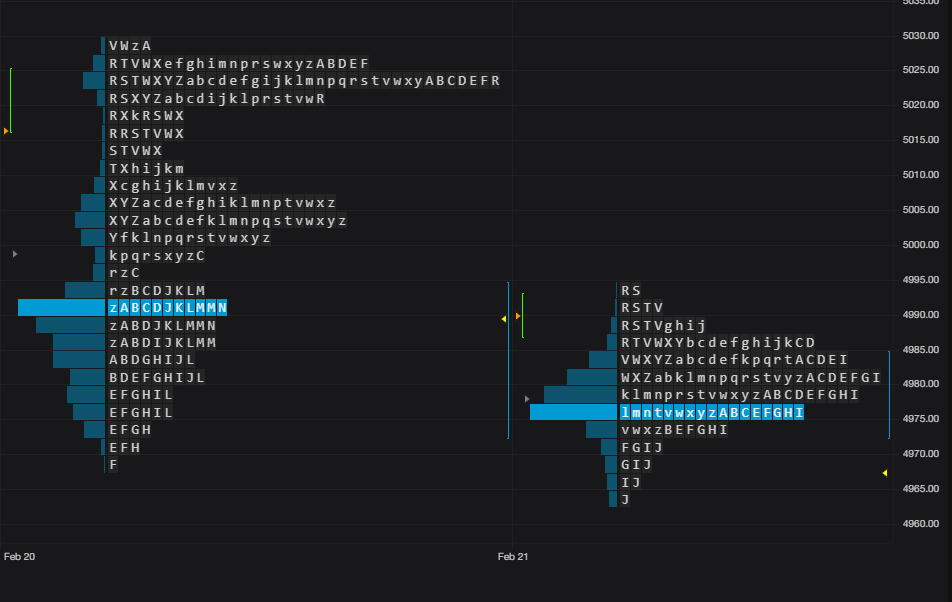
CQG One carries on the tradition of CQG product offerings with best-in-class market data visualization with the introduction in CQG One version 9.1.45025 the CQG Profile chart type and the CP study.
First, an introduction to Market Profile.
CQG Profile charts display price… more
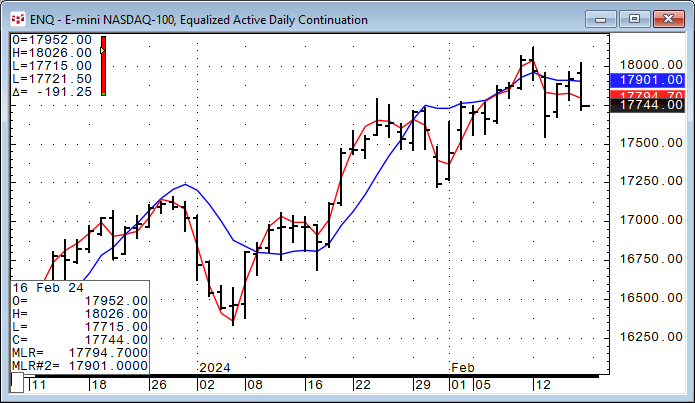
This study goes by a number of other names, including the end point moving average, least squares moving average, moving linear regression, and time series forecast.
To explain this study Microsoft’s Excel LINEST function will be the basis. The LINEST function calculates the statistics for… more
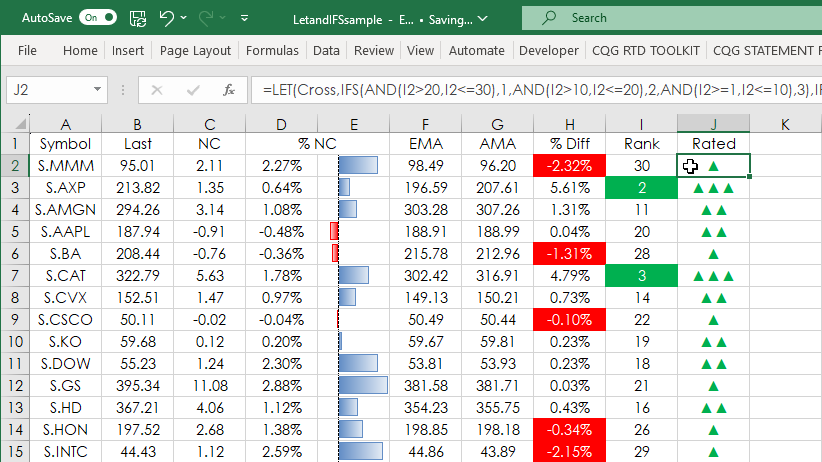
Microsoft Excel 365 introduced the LET Function. Excel 365 or Excel 2016 introduced the IFS function. This post details using the two functions for tracking the performance of the stocks comprising the Dow Jones Industrial Average.
Using the LET function enables you to assign names to… more
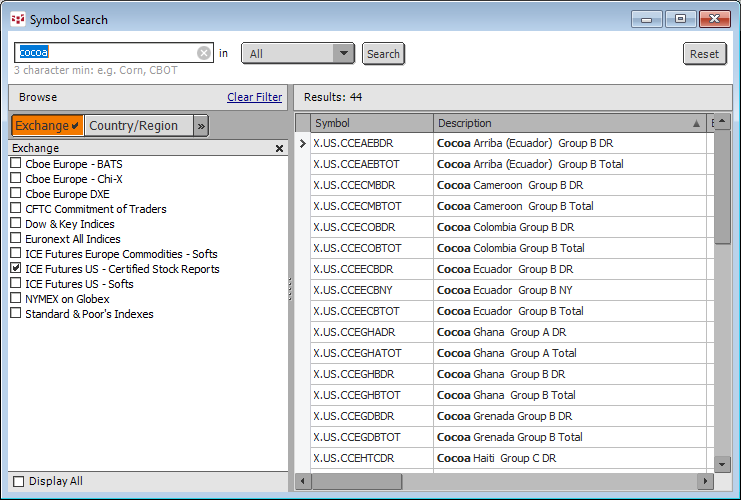
Cocoa certified stocks are bags that have been graded by the ICE exchange by ICE approved graders and are warehoused in exchange approved warehouses around the world. ICE reports the current number of stocks daily.
CQG has added the data found under the Symbol Search tool.
A… more
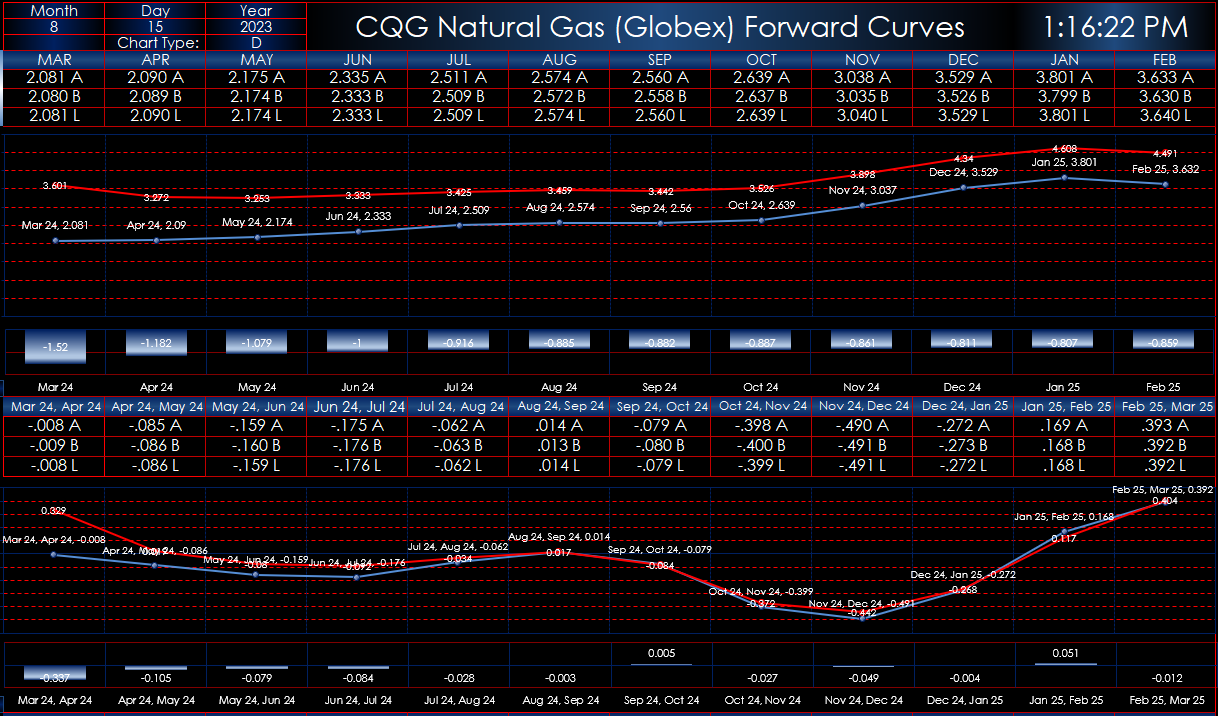
This Microsoft® Excel dashboard uses RTD formulas based on a user input symbol (please use all capital letters) to display a forward curve of the outrights and forward curves for six calendar spreads: One month to six months.
You enter the month, day, and year at the top of the dashboard… more
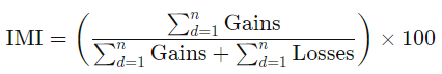
Oscillator studies are a part of most traders’ and analysts’ approaches to analyzing the markets. Oscillators calculate differences between prices, which detrends the price data. In this post, the topic of oscillators will be detailed including the basics of the oscillators available in CQG One… more
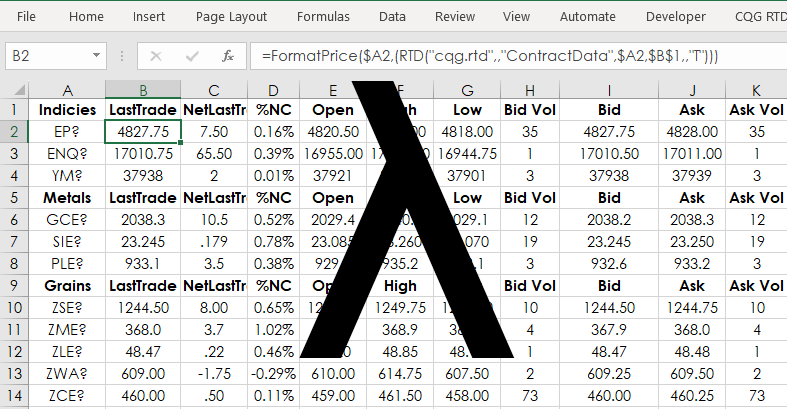
The LAMBDA function is used to create reusable custom functions, which can be called using a "friendly" name. As an introduction to using the LAMBDA function, a previous post detailed using the Excel LEN function to determine the number of decimals of the tick size for a symbol. That result was… more
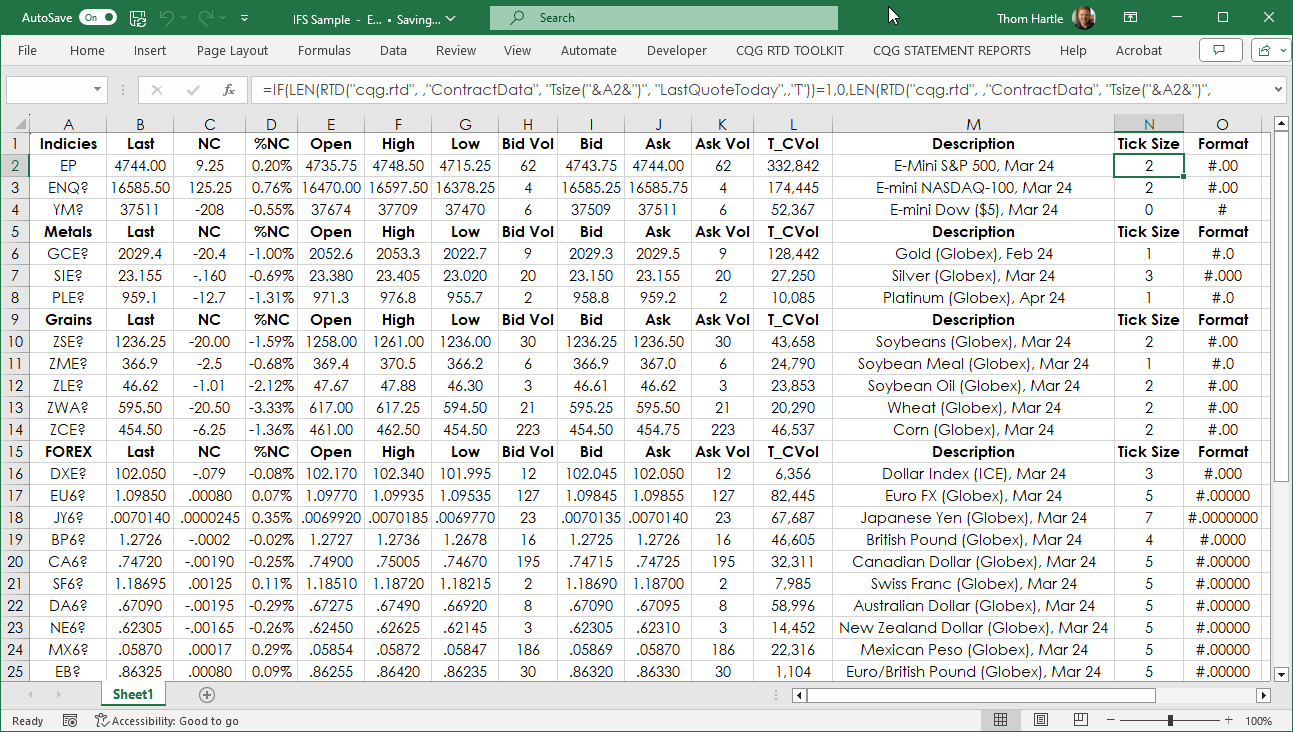
Microsoft Excel 2016 introduced the IFS function. This function can replace using nested IF functions. Below is an example of nested IF functions:
=IF(N2=0,"#",IF(N2=1,"#.0",IF(N2=2,"#.00",IF(N2=3,"#.000",IF(N2=4,"#.0000",IF(N2=5,"#.00000",IF(N2=6,"#.000000",IF(N2=7,"#.0000000"))))))))The… more